POPULATION ECOLOGY
ACTIVITY
|
General Biology - Population Ecology
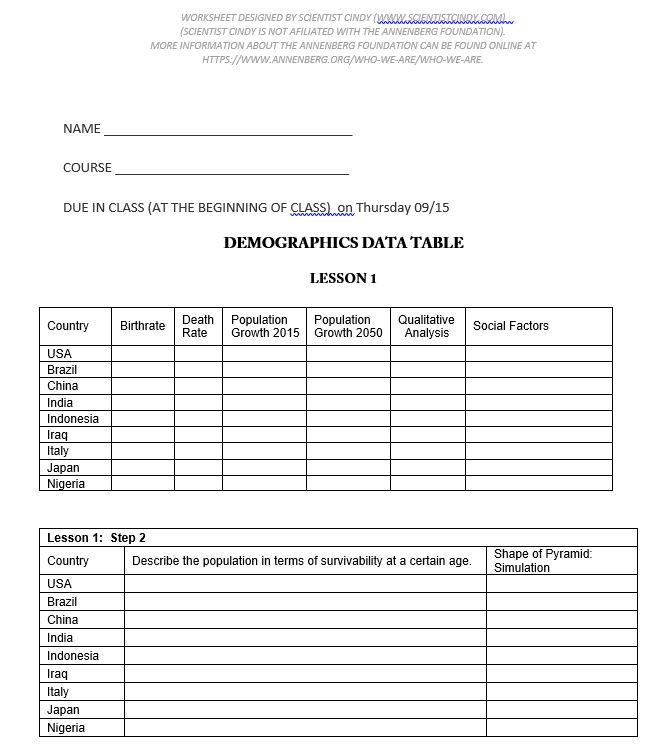
https://www.learner.org/courses/envsci/interactives/demographics/ This activity worksheet has been designed to be used in conjunction with the open source Carbon Cycle Interactive module (located at the URL indicated above) developed by the Annenberg Foundation. Before civilization began to impact the human life cycle approximately 10,000 years ago, human beings had high birth and death rates. Today the world is in the midst of a demographic transition — a transition to low birth and death rates — as the ability to control both disease and reproduction increases. Along the way, between these extremes, populations go through an intermediate period of continued high birth rates, combined with low death rates, resulting in a population explosion. Because countries span a continuum along this transition, looking at the present demographics of countries around the world provides an opportunity to look forward or backwards in time: a post-transition country can get a glimpse of a situation resembling its own past from countries still in transition, and a transitional country may get a hint of its demographic future from countries that are further along the continuum. At the most basic level, the increase or decrease in population can be calculated by following the simple formula: BIRTH RATE - DEATH RATE + IMMIGRATION = GROWTH RATE Please note that our model does not take immigration into account, so we are looking at birth and death rates only. Birth and death rates are expressed in a number of different ways. Overall rates are often expressed as the number of births per woman over her whole life, and deaths per year. But for use in predicting population growth, population models use birth and death rates specific to each age group, over a step of 5 years. In this simulator, the overall rates are shown on buttons in the grey box. When you click the buttons, a detail dialog shows the age group specific rates. DIRECTIONS:
ANSWER THE FOLLOWING QUESTIONS regarding the first web activity
ANSWER THE FOLLOWING QUESTIONS regarding the second web activity
5) About what century did we begin to see a significant population increase in the US? 6) When was the Industrial Revolution? 7) What impact did the Industrial Revolution have on population? 8) Use your cursor to select any (OPEN CIRCLE) dot of your choice in the map at any point in time you chose. Write down the information of interest about that place at that time. 9) Pick any point in time that interests you and write down the significant MILESTONES of that time. 10) What do you think was the single most important factor in determining human population throughout history and WHY? |

Helpful reading –
The overall population growth rate is only one of the differences among countries in different stages of the transition. The age-based population structure is also greatly affected. Look at the shape of population pyramid for all of the countries in turn. (The Population by Age Group graph is a standard representation of population structure, called a population pyramid.) Compare the pyramid shape of the countries that you found to be late in the transition to those that are earlier in the transition. Predict what you expect the shape of each pyramid to be in 2050. Then simulate it, and note the actual resulting pyramid shape. For example, the United States has a house-shaped “pyramid”. Nigeria has a young-heavy wide base. Indonesia looks like an onion dome in 2015. Decreasing populations progress into an “inverted pyramid”, where the top is wider than the base. | ||