THE CARBON CYCLE - ACTIVITY
|
This worksheet was designed by SCIENTIST CINDY using the Carbon Cycle Interactive module hosted by the ANNENBERG FOUNDATION.
www.scientistcindy.com is not affiliated with the ANNENBERG FOUNDATION. More information about the ANNENBERG FOUNDATION can be found online at https://www.annenberg.org/WHO-WE-ARE/WHO-WE-ARE | ||||||
Environmental Science - Carbon Cycle Activity
https://www.learner.org/courses/envsci/interactives/carbon/
This activity worksheet has been designed to be used in conjunction with the open source Carbon Cycle Interactive module
(located at the URL indicated above) developed by the Annenberg Foundation.
The Carbon Cycle Interactive module is a virtual lab that uses a robust model of the carbon cycle. This virtual lab models how carbon circulates through the atmosphere, biosphere, oceans, and the Earth’s crust.
In this activity, you will be altering the atmospheric CO2 levels.
INSTRUCTIONS:
1. Go to https://www.learner.org/courses/envsci/interactives/carbon/ .
2. Read the overview paragraph and answer questions 1 and 2.
3. Click on the “OPEN SIMULATOR” icon.
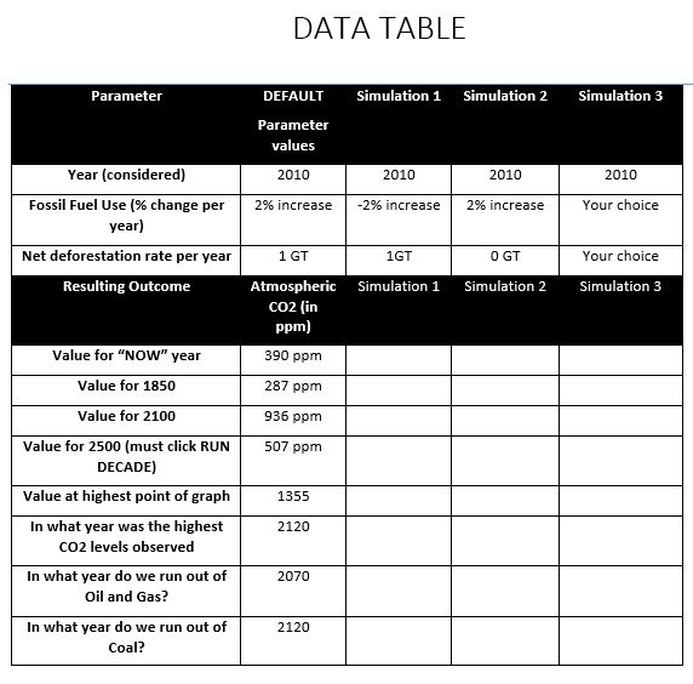
4. Run the default simulation and the indicated 3 additional test simulations with the parameters set to those that are given in the table. (the 3rd simulation allows you to choose the value of your variables).
TIPS:
Notice that most of your data can be found by placing your cursor over points of interest in the generated graph.
You will have to click RUN SIMULATION a DECADE several times in order to get some of these data points.
You will also have to repeat the simulation several times to gather the needed data.
You will need to click RESET to start the simulation over again.
There is a tutorial on the website for more helpful information.

Questions:
QUESTIONS:
1. What does the Overview section of the virtual lab say about the CO2 levels between 1850 and 2015?
2. How are ancient CO2 levels measured?
3. When we run the simulations, explain what is happening at the highest point of the graph.
4. After the fossil fuels are exhausted, explain how dissolved CO2 levels change between the time the fossil fuels run out and the time when the amount of dissolved carbon dioxide in the deep ocean no longer changes.
5. What is the effect of high CO2 levels in the deep ocean?
6. After the fossil fuels are exhausted, explain how the atmospheric CO2 levels change between the time the fossil fuels run out and the time when the atmospheric level of CO2 no longer changes.
7. Explain how excess CO2 levels affect terrestrial plant CO2 levels change between the time the fossil fuels run out and the time when the terrestrial plant level of CO2 no longer changes.
8. After the fossil fuels are exhausted, explain how the soil CO2 levels change between the time the fossil fuels run out and the time when the soil level of CO2 no longer changes.
9. What is the effect of high CO2 levels in the atmosphere?
10. What is the effect of high CO2 levels in terrestrial plants?
11. What is the effect of high CO2 levels in the soil?
12. What does ppm mean?
13. What does GT mean?
