Heart Rate, Blood Pressure, Electrocardiogram Lab
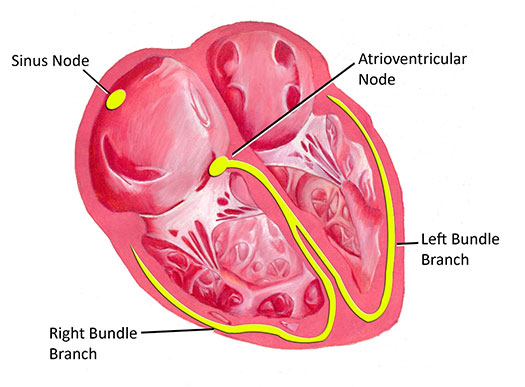
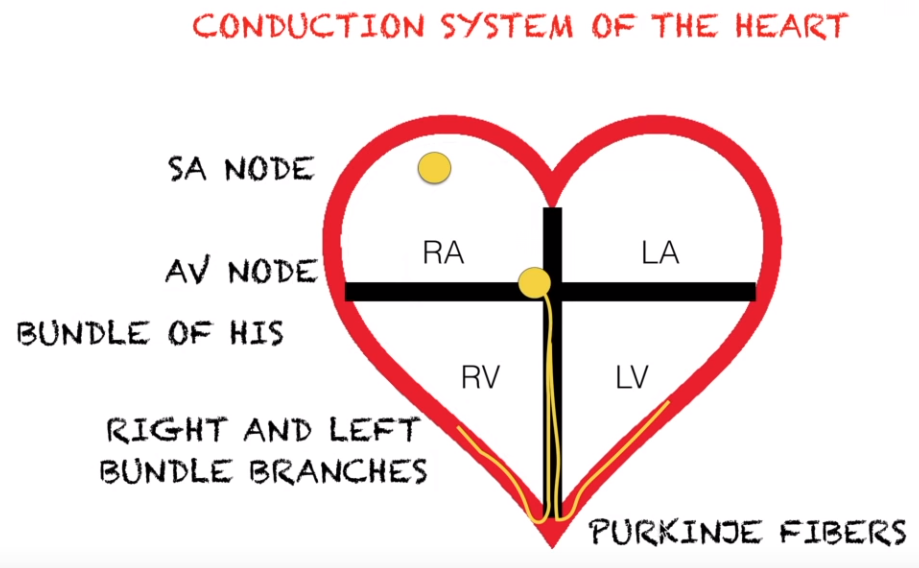
The conduction system of the heart.
Electrical pulses in the heart are controlled by special groups of cells called pacemaker cells that exist in areas of the heart referred to as nodes.
The Sinoatrial Node
The SA node is also known as the sinoatrial node, or more simply as the sinus node contains a cluster of specialized cells called pacemaker cells. The SA node is considered the pacemaker of the heart, because the SA node initiates the heart beat.
The SA (sinoatrial) node generates an electrical signal that causes the upper heart chambers (atria) to contract. The signal then passes through the AV (atrioventricular) node to the lower heart chambers (ventricles), causing them to contract, or pump. The SA node is located on the superior wall inside the right atrium of the heart.
The SA node is where the beginning of the conduction takes place.
The AV node is a cluster of specialized electrical cells positioned right near the middle of the heart. It is responsible for conducting electrical impulses from the top 2 chambers of the heart, the right and left atria, to the bottom 2 chambers of the heart, the right and left ventricles. Typically it is the only pathway electricity can travel to get from the top to the bottom of the heart.
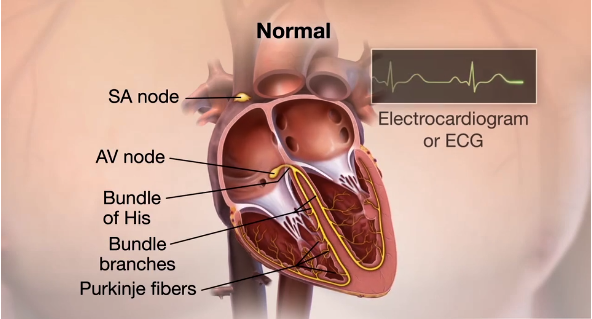
- The SA node depolarizes to threshold and fires an action potential.
- That action potential is conducted from the SA node (sinoatrial node) to the AV node (atrioventricular node).
- The impulse then travels from the AV node through a structure called the bundle of His.
- The bundle of His branches off (bifurcates) to form the left bundle branch and the right bundle branch.
- The left and right bundle branches travel to the apex of the heart where they become Purkinje fibers.
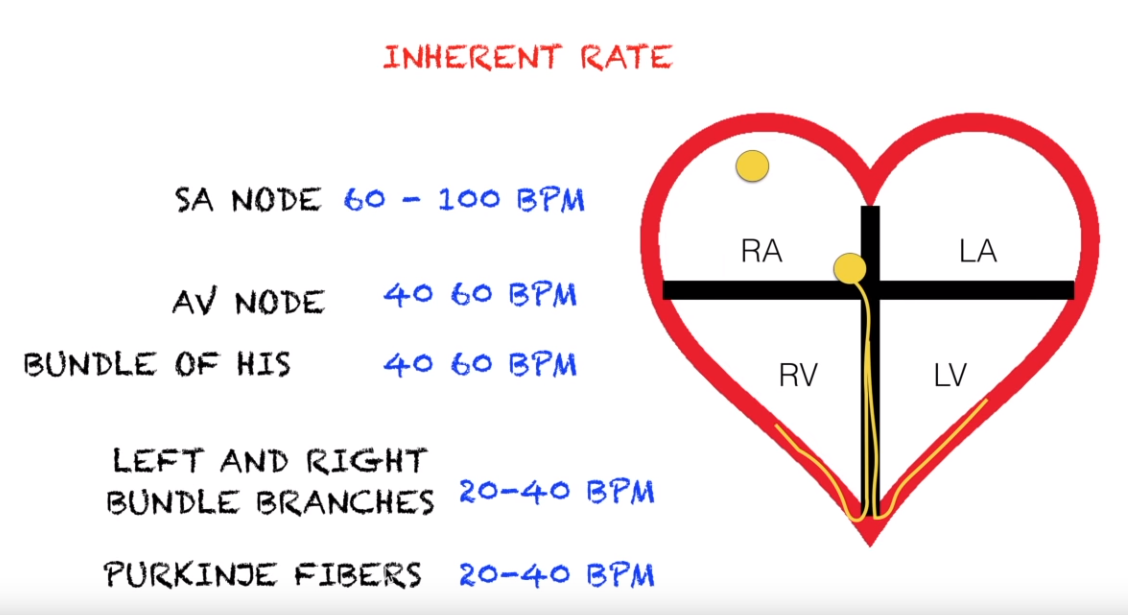
When the heart is functioning properly, the impulse generated at the SA node will continue all the way through the Purkinje fibers, generated a resting heart rate of ~ 60 - 100 bpm. However, if there is a blockage or a weak or absent electrical impulse from the SA node, the AV node responds by generated its own electrical impulse. When this occurs, we find that the resting heart rate is much lower (between 40 - 60 bpm). The bundle of His, also has the ability to generate its own impulse which also results in a lower heart rate of 40 - 60 bpm. Similarly, if the impulse from the AV node or the bundle of His is weak, an impulse may be generated by the left and right bundle branches or the Purkinje fibers. When the impulse is generated by the bundle branches or the Purkinje fibers, the heart rate becomes dangerously low (only about 20 to 40 bpm).
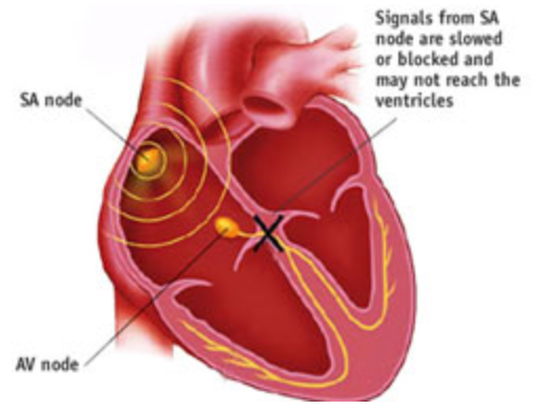
- The AV node is also known as the gatekeeper of the heart, because it dictates which electrical signals will get propagated to the rest of the heart.
- For example, if the SA node generates a weak impulse (possible due to a blockage somewhere), the AV node will perceive this as abnormal and will NOT allow the impulse to proceed onward.
- The AV node has the ability to either pass on the impulse it has received from the SA node, or it will initiate its own electrical impulse.
How to interpret an ECG in SIX STEPS
An electrocardiogram — abbreviated as EKG or ECG — is a test that measures the electrical activity of the heartbeat. With each beat, an electrical impulse (or “wave”) travels through the heart. This wave causes the muscle to squeeze and pump blood from the heart.
The ECG (EKG) has different parts.
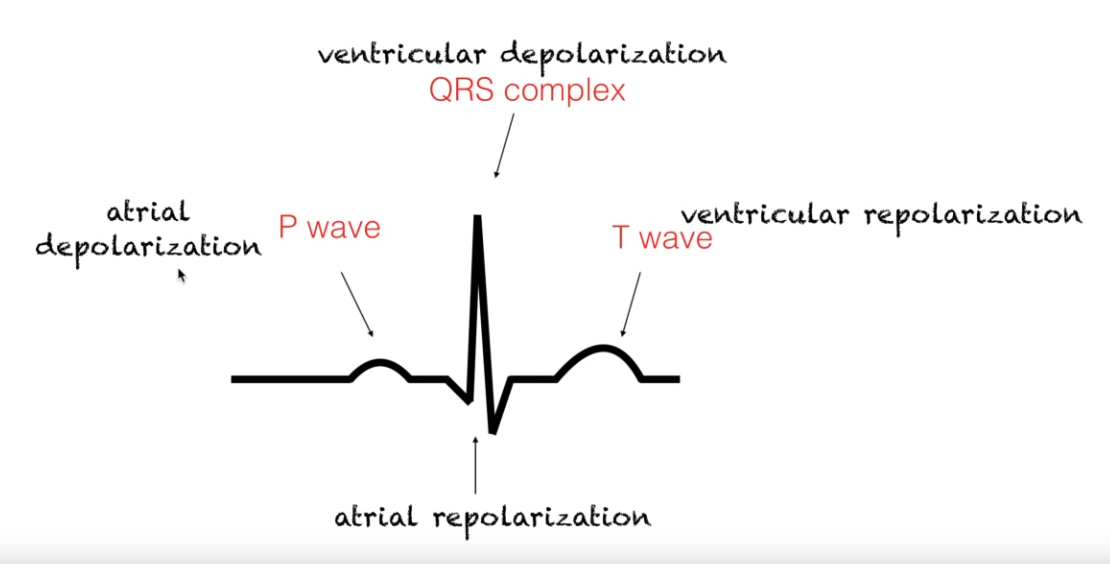
The major features of the ECG include (in order):
The major features of the ECG include (in order):
- the P wave
- the QRS complex
- the T wave
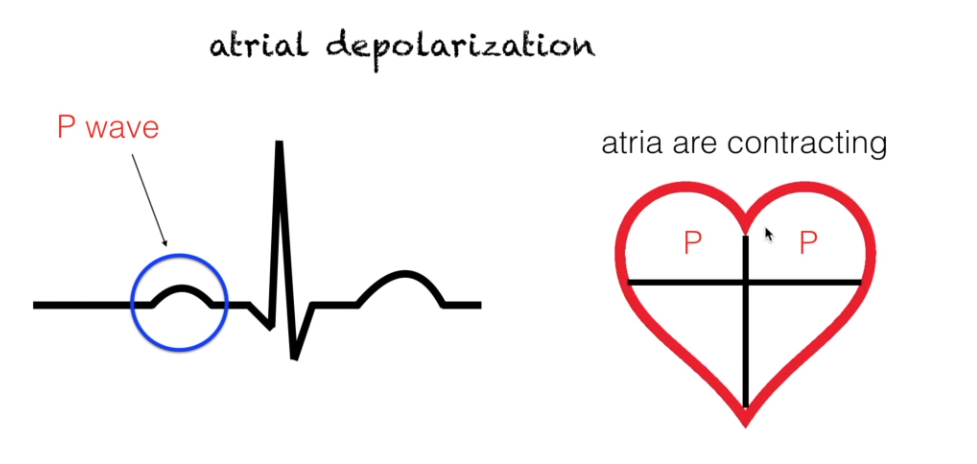
- The P wave represents atrial depolarization aka atrial contraction or atrial systole.
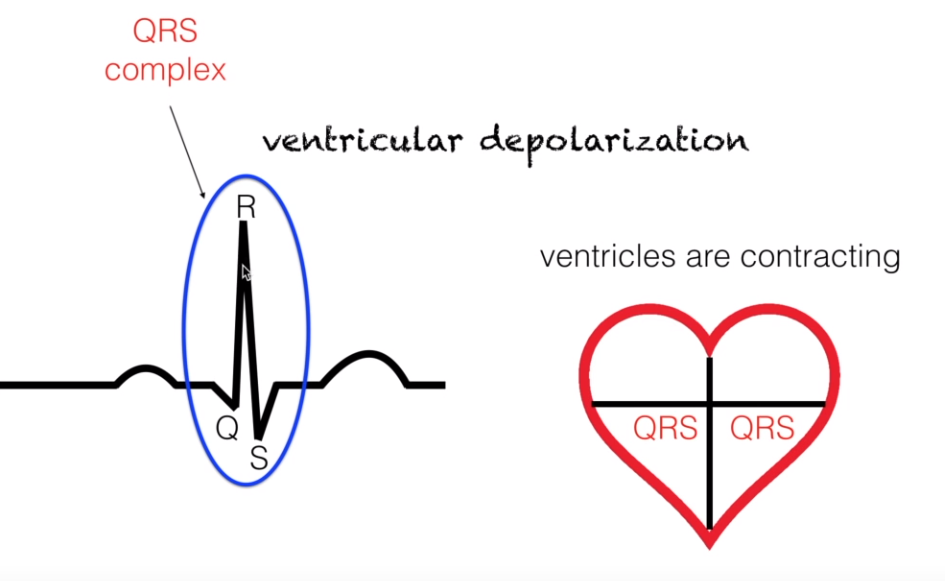
- The QRS complex represents ventricular depolarization aka ventricular contraction or ventricular systole.
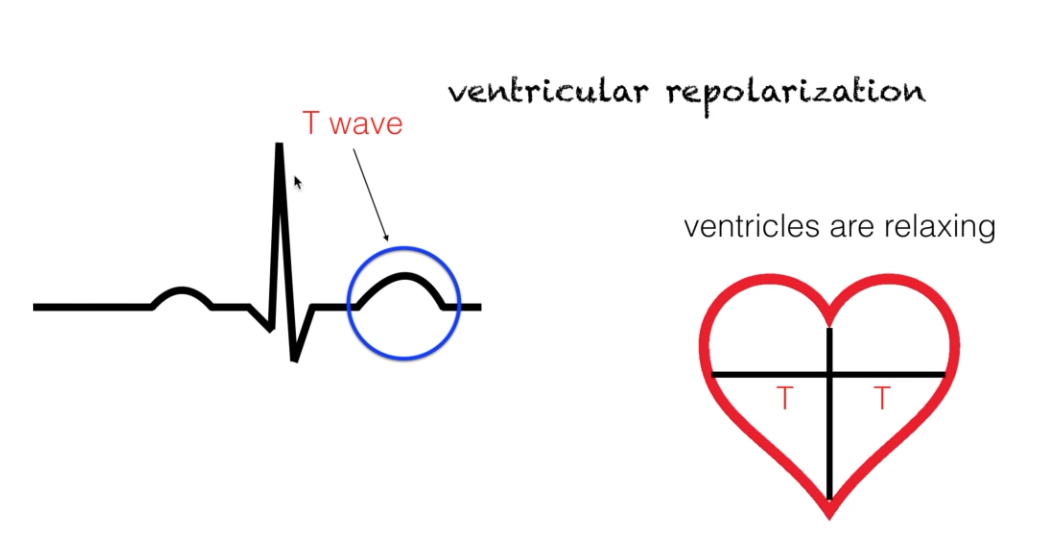
- The T wave represents ventricular repolarization aka ventricular relaxation or ventricular diastole.
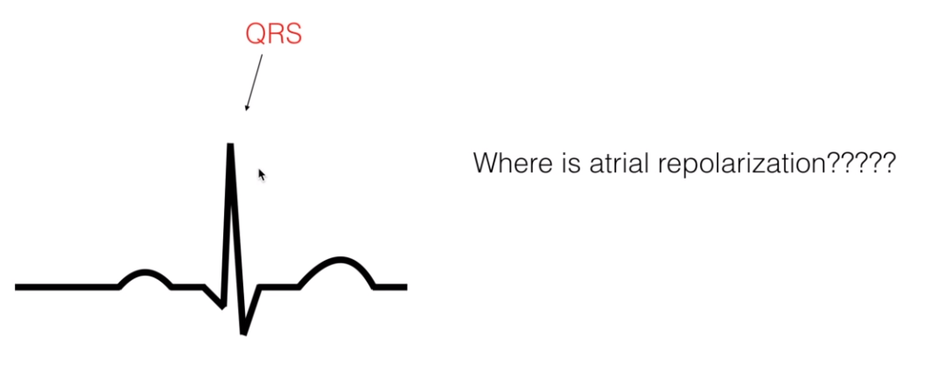
*Atrial repolarization also occurs, but it does not show up on an ECG, because it is masked by the much larger signal of the contracting ventricles occuring at the QRS complex.
The QRS structure is so much larger than the P wave, because the ventricles tend to contract stronger than the atria do. Because of the, QRS complex will mask the atrial repolarization. However, we know that atrial repolarization takes place after the P wave, and would coincide with the QRS complex.
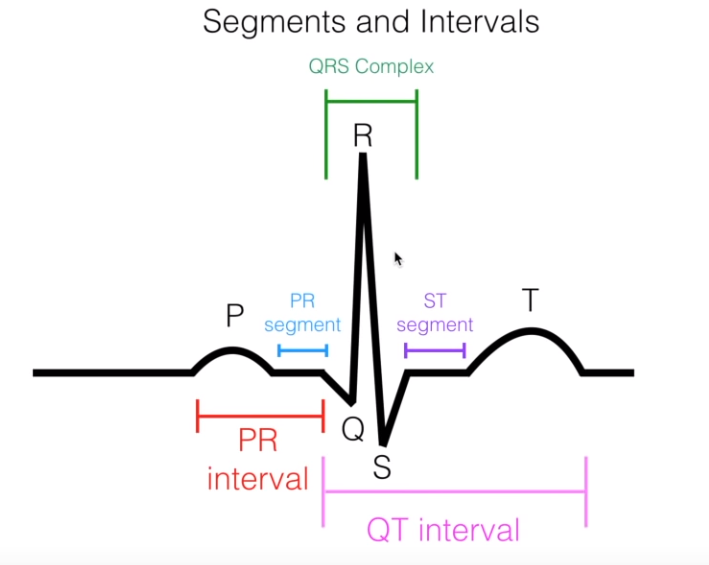
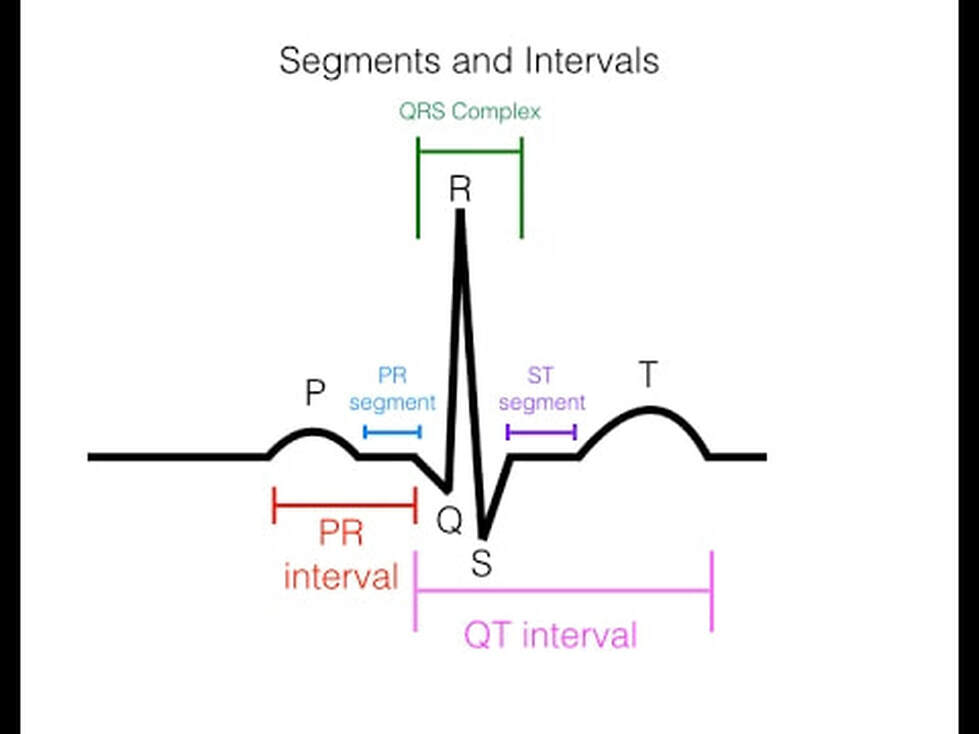
Segments and Intervals of the ECG include:
The most important one for understanding the ECG, is the PR interval.
- The PR interval
- The PR complex
- The ST segment
- The QT interval
The most important one for understanding the ECG, is the PR interval.

EKG strip
Electrical signals can be measured using an ECG strip. This strip contains larger boxes that are divided into a 5 by 5 grid of smaller boxes.
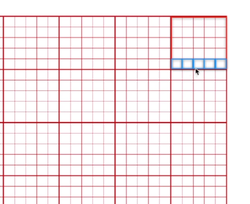
This horizontal axis of this grid represents TIME. Each small
box represents a time interval of 0.04 seconds. Since there are 5 of these small boxes, each large box represents 0.2 seconds (0.4 X 5 = 0.2).
box represents a time interval of 0.04 seconds. Since there are 5 of these small boxes, each large box represents 0.2 seconds (0.4 X 5 = 0.2).
How do we interpret an ECG?
A normal P wave would be present and upright. If the P wave is
absent or inverted, this indicates dysrhythmia perhaps from a junctional rhythm.
The PR interval PR is the distance between the beginning of the P wave and the beginning of the QRS complex. We can measure the PR interval by counting the number of small boxes it contains and multiplying it by 0.04 seconds. A normal PR interval is 0.12 seconds.
If the PR interval is more than ~0.20 seconds, this indicates dysrhythmia.
We can measure the QRS complex in a likewise manner by counting the number of small boxes the complex spans, then multiplying by 0.04 seconds. A normal QRS complex should measure between 0.06 and 0.12 seconds. A QRS complex than lasts longer than 0.12 seconds indicates dysrhythmia.
We can use an ECG to analyze the patient's heart rate or rhythm, to determine if it is regular or irregular. This is done by measuring the distance (counting the small boxes) between R's.
|
ours ours and ours some people use calipers to do this but really all you need is an index card mark your R's and March them with the rest of the ours if they have the same distance then your rhythm is regular otherwise they are irregular fifth step is when we identify our heart rate now before we calculate our heart rate it is very important for us to know that our EKG is a six seconds trip and the way we will know this is when we find this three lines right over here if you see these lines this means that from the first line up to the third line that would be your six second strip the reason why this is important is that if it is a six second strip then we can do a technique called the six second method and the way we do this is that we count the number of ours between these three lines right here and multiply them by ten so for this trip we have one two three four five six and multiply that by ten that will give us a heart rate of 60 beats per minutes one thing to remember is that this method works best for irregular rhythms and another tip that I can tell you is that you have to be very very careful in using the six-second method you always have to verify that the strip that you're reading is indeed a six second strip I know some teachers include strips that appear to be six second strips but they're really not they don't have these three lines right here and students actually mess up the heart rate because they use the six second method this method only works for six second strips okay second method that we can use to calculate the heart rate is the big box method and the way this works is that we divide 300 by the number of big boxes between two R's our magic number is 300 so for this trip we are going to use these two R's right here so we have 1 2 3 4 5 big boxes in between ours and so using the formula 300 divided by 5 we have 60 beats per minute this method works better for regular rhythms only and this is actually the method that you can use if you don't have a 6 second strip in front of you and the final step is interpret your strip so that is it for today guys I hope you find that helpful and if you haven't already please hit the like and subscribe button and let us know in the comment section below if you want us to make videos about this with me on such as heart blocks or junctional rhythm and once again my name is done mint signing out |
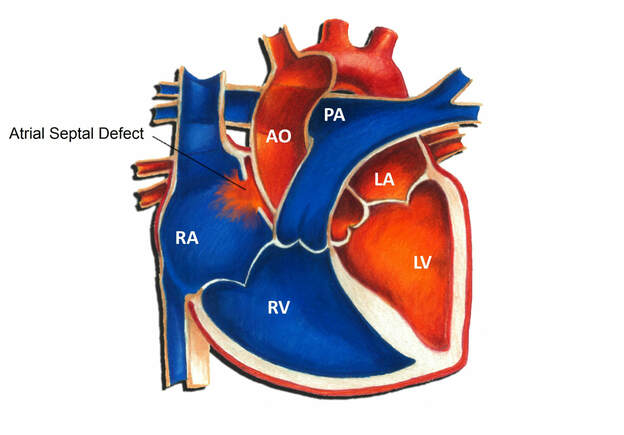
An atrial septal defect (ASD) is a hole in the atrial septum, the upper wall of the heart separating the right and left atria. An ASD is a congenital heart defect, in other words, a birth defect of the heart. Congenital heart defects are the most common form of birth defects, occurring in approximately 1 per 150 individuals. An ASD is one of the more common congenital heart defects; the overall incidence is 2-3 per 1000. An ASD forms when the upper wall fails to properly close in the womb, leaving a hole.

